iopsys
iopsys Operating System
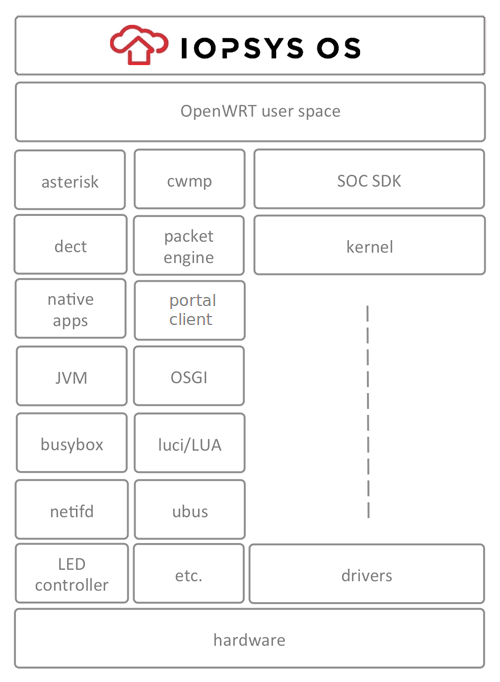
Iopsys provides the first truly open source gateway software suited for the operator market. It supports all features required by modern business critical Gateway software. To improve the ease of field upgrades and service deployment, the Iopsys operating system contains a packet engine which provides modular installation/removal of native programs and application bundles. If Java is preferred, any OSGi framework can be installed. The iopsys SDK will enable both the operator and third party developers to develop functions and applications that may be downloaded and installed in the OS.
iopsys Portal
The iopsys Portal is a standalone software suite composed of a back-end management server and a portal front end. The management server handles the account administration and the communication with the iopsys communication engine residing in the registered devices. The portal front end handles device registration, customer triggered installation and running of applications, software updates and manages the gateway functions. Once powered-on the gateway will connect to a portal were the customer can register his account and get access to services beyond triple play.
iopsys Client
The iopsys communication engine is an embedded client software that can be integrated into any device that should be cloud connected. Typical devices are Gateways, Smart Phones, Tablets and Web Cameras but it could be just about anything that should be part of “The Internet of Things”. The client connects any device, for example a gateway, via an encrypted XMPP tunnel to a specific portal. A Smart Phone running a Home Control application including the client can now communicate to the gateway via the portal from anywhere at any time using the encrypted XMPP tunnel. The communication works behind any NAT and also provides for file transfers and proxy tunnel communication.
iopsys Ecosystem
Iopsys offers one of the first true ecosystem program for residential gateways. Third party software providers may port their existing or new applications to the iopsys operating system using the iopsys SDK. By running multiple applications on the gateway the in-home box count is reduced and as a side effect this becomes positive to the environment. In order to keep tab of the gateways available resources, iopsys has a built-in resource manager, managing the resources and priorities of the different applications.
Introduction
Administration of the gateway is done through a web interface. All settings are accessible through an address on your local network.
Requirements
To access the web interface, you need the following:
An installed gateway device.
A computer connected to the LAN or WLAN port on the device.
A web browser installed on the computer.
The default address for the web interface is http://192.168.1.1.
Overview
Access web interface
To access the web interface you need to use your web browser. There are multiple ways of accessing the interface.
User Roles
The web interface uses Roles to provide and restrict access to the various features in the device.
There are four pre-defined roles: User, Support, Admin, and Root.
User Modes
In addition to User Roles, the User Modes may provide further constraints on what settings and features are displayed in the web interface.
Note: The mode affects display only, the features are still available and operational.
Features
Depending on your device and/or geographical region, certain features may be unavailable in the interface.
Applying changes
When you change a setting or a value in the interface, it gets added to a list of changes. The changes will not take effect until you click apply.
Access web interface
To access the web interface you need to use your web browser. There are multiple ways of accessing the interface.
IPv4
The standard IPv4 address for the interface is http://192.168.1.1.
Hostname
The web interface can be accessed through a default hostname, for example inteno.lan/ or routerlogin.net/, or through custom hostnames set up by the provider.
IPv6
An IPv6 address or IPv6 hostname can also be used to access the web GUI. The exact address will vary with your provider.
Open GUI
- Launch your web browser
- Enter the address (for example: http://192.168.1.1) / http://(inteno.lan/ or http://routerlogin.net/ / http://2001:0:0:0:DB8:800:200C:417A
- Press [Enter].
You are taken to the web interface login page.
Login
To login to the web interface, you use a user name and a password.
Configuration
(For default passwords see: User Roles).
Note: Your operator may have specified different passwords and user levels. If so, you need to request those from your operator.
Log in to the web interface:
- Enter a user name
- Enter the password
- Click OK.
You are taken to the web interface Overview page.
User Modes
In addition to User Roles, the User Modes may provide further constraints on what settings and features are displayed in the web interface.
Note: The mode affects display only, the features are still available and operational.
Overview
Basic Mode
Basic mode provides access to a selected set of settings and aspects of features, displaying a reduced set of options. This mode is suitable for the most common tasks and configurations.
Expert Mode
Expert mode provides access to a larger number of settings and aspects of features. This mode is suitable when you have deeper technical knowledge and want to do specific customizations or troubleshooting.
Basic Mode
Basic mode provides access to a selected set of settings and aspects of features, displaying a reduced set of options. This mode is suitable for the most common tasks and configurations.
Features
In basic mode, all Expert mode settings and views are hidden from the interface. However, if you select a particular task in basic mode that requires expert mode settings, they will automatically be displayed.
Expert Mode
Expert mode provides access to a larger number of settings and aspects of features. This mode is suitable when you have deeper technical knowledge and want to do specific customizations or troubleshooting.
Features
In expert mode, all Basic mode settings and views are also shown.
User Roles
The web interface uses Roles to provide and restrict access to the various features in the device.
There are four pre-defined roles: User, Support, Admin, and Root.
User
The User role has restricted access to basic set of features.
login: user
password: user
Support
The Support role has elevated access to basic and a set of advanced features.
login: support
password:support
Admin
The Admin role has unrestricted access to all basic and advanced features.
login: admin
password:admin
Root
The Root role has unrestricted access to the device, and can be used for command line access to the device via ssh.
login: root
password:root
Features
Depending on your device and/or geographical region, certain features may be unavailable in the interface.
Availability
Certain features may not be available in your interface, depending on several factors:
Device - Your device may be limited in which ports are avaible.
Geographical region - Features might not be offered in some regions or countries.
Operator Settings - Your operator may have restricted, altered or added features in the software.
Applying changes
When you change a setting or a value in the interface, it gets added to a list of changes. The changes will not take effect until you click apply.
Configuration
The unapplied changes and apply button are shown at the bottom of the window.

To make the changes take effect click Apply.
To keep the current state without any changes click Cancel.
Overview
The Overview page shows the most important statuses and settings for your device.
Parts
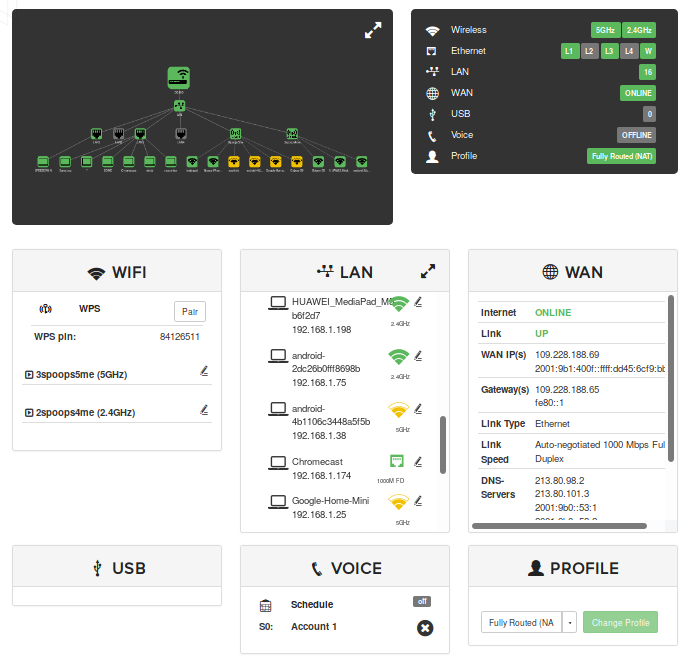
The overview has three parts: a device network map, configuration shortcuts, and status panels.
Device Network Map
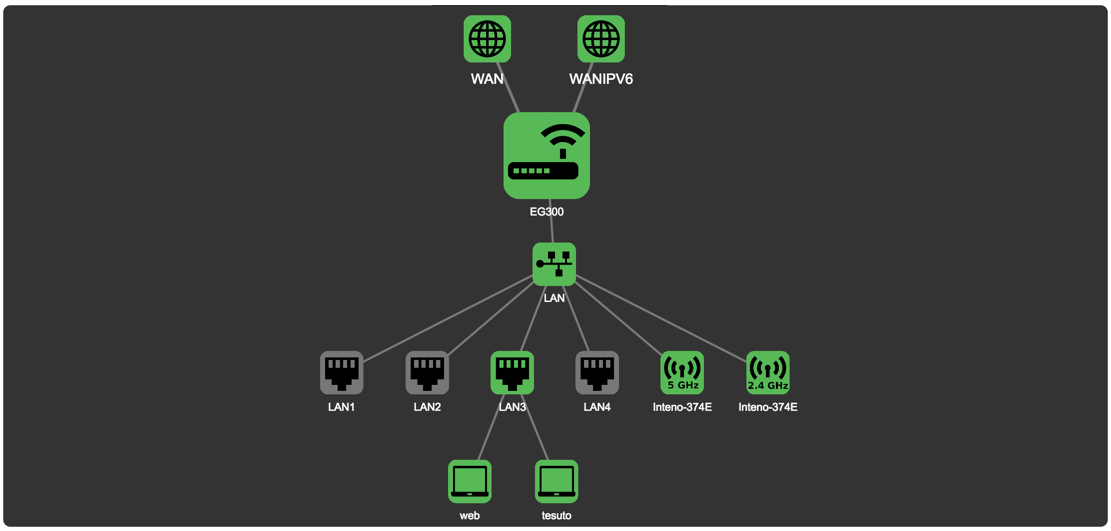
The device map shows how your device is connected to the LAN and the WAN, as well as other devices in the local network.
Configuration Shortcuts
The configurations show status for and provide shortcuts provide quick access to various common settings.
Status Panels
The status panels display status information about selected features. They also allow you quick access to configuration of the most common features.
Device Network Map
The device map shows how your device is connected to the LAN and the WAN, as well as other devices in the local network.
View
Colors
The status of a device is indicated by the color of the icon.
| Color | Status |
|---|---|
| Green | Enabled and active |
| Black | Enabled, not active |
| Yellow | Active, with warnings. |
| Red | Active, not functional. |
Details
More detailed Information about the status of an item in the map is availabe by pointing the cursor at an icon in the map.
View

The information displayed in the popups varies with the item being viewed.
WAN


Device
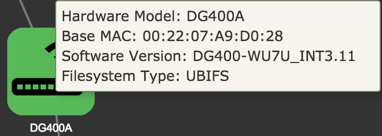
LAN

Port

Wifi
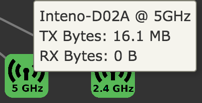
Client

Configuration Shortcuts
The configurations show status for and provide shortcuts provide quick access to various common settings.
Configuration
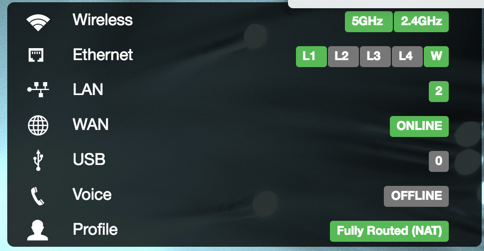
| Option | |
|---|---|
| Wireless | Active wireless radios. |
| Ethernet | LAN ports in use on the device. |
| LAN | Active LAN |
| WAN | Status of WAN connection. |
| USB | Connected USB devices, if any. |
| Voice | Voice port status, if any. |
| Profile | Selected network profile, if any. |
Status Panels
The status panels display status information about selected features. They also allow you quick access to configuration of the most common features.
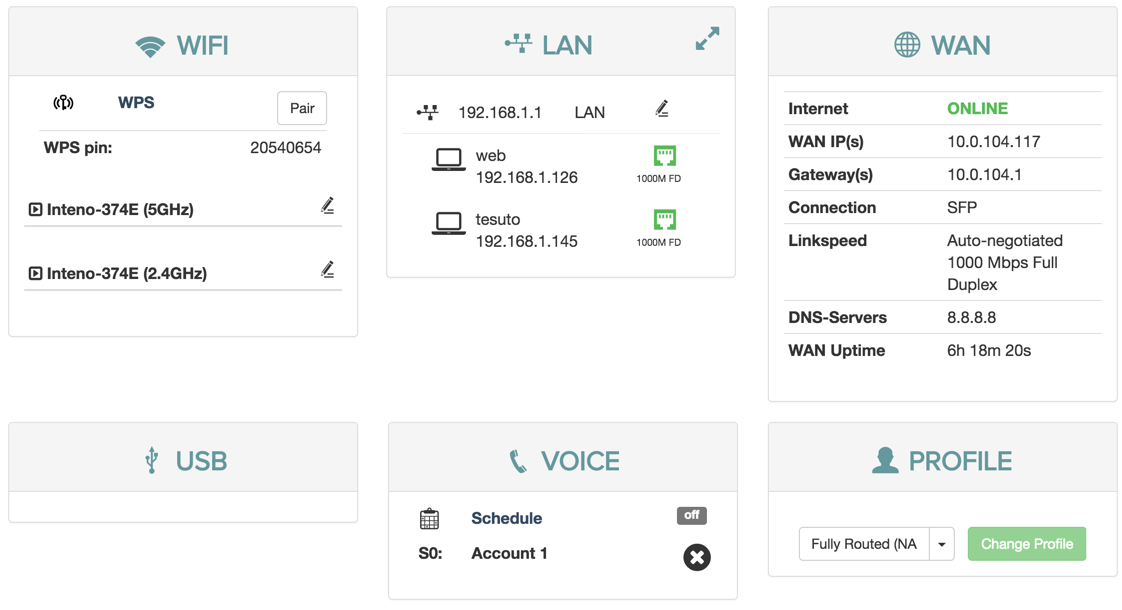
WIFI
The WiFi status panel lets you change the default wireless security settings to make your network more secure.
You can also view the wifi status and edit the wireless interface.
Additonally, you can WPS to set up clients.
LAN
WIFI
The WiFi status panel lets you change the default wireless security settings to make your network more secure.
You can also view the wifi status and edit the wireless interface.
Additonally, you can WPS to set up clients.
View
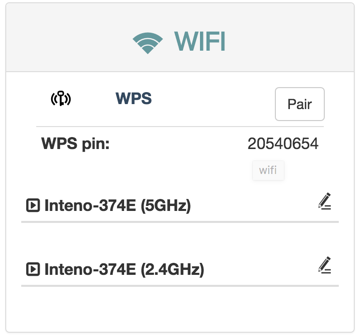
WPS settings
WPS makes it easier to connect other wireless devices to your device on an encrypted channel.
Edit 5GHz Wireless Interface
In the edit wireless interface view you can change different aspects of your interface.
Edit 2.4GHz Wireless Interface
In the edit wireless interface view you can change different aspects of your interface.
WPS settings
WPS makes it easier to connect other wireless devices to your device on an encrypted channel.
Edit 2.4GHz Wireless Interface
In the edit wireless interface view you can change different aspects of your interface.
Configuration
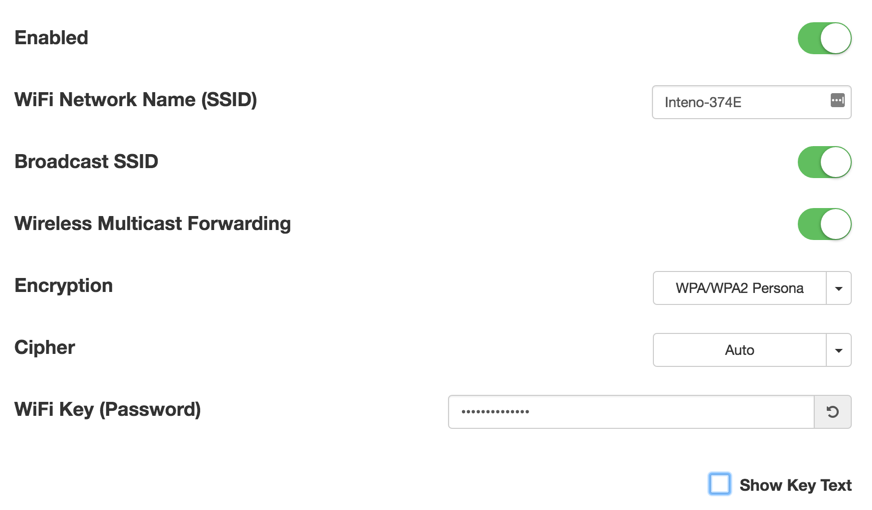
Wireless Settings
To open The wifi status view for 2.4GHZ:
- Click 2.4 GHz to open the wifi status view
To edit the wireless interface for a radio:
- Click the
 edit button to open up the wireless interface settings
- Edit the wireless interface
- Click Save
Edit 5GHz Wireless Interface
In the edit wireless interface view you can change different aspects of your interface.
Configuration
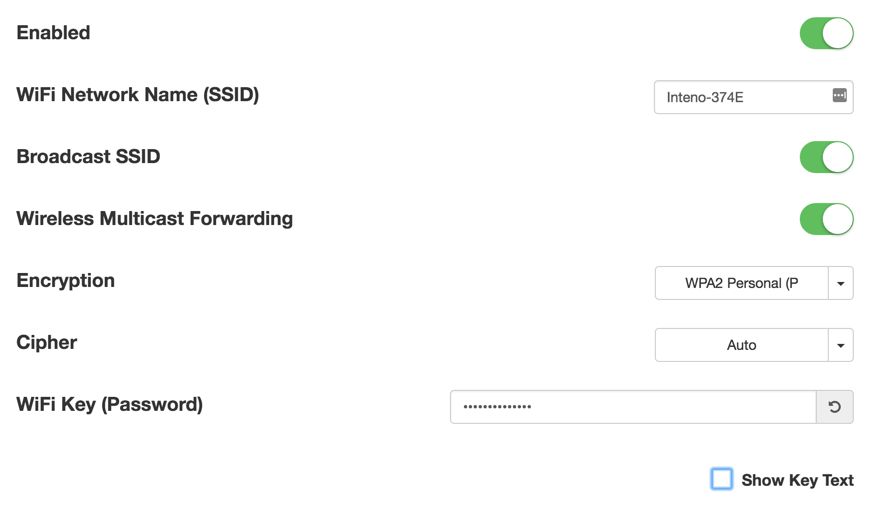
| Item | Comment |
|---|---|
| Enabled | Toggle interface on or off. |
| WiFi Network Name | Edit name of SSID network. |
| Broadcast SSID | Toggle to make the network SSID visible or invisible. |
| Encryption | Selected encryption method. |
| Cipher | Form of Cipher. |
| WiFi Key (Password) | Text to use as wifi key. |
| Show Key Text | Displays the wifi key text. |
Wireless Settings
To open the wifi status view for GHZ:
- Click 5GHz to open the wifi status view
To edit the wireless interface for a radio:
- Click the
 edit button to open up the wireless interface settings
- Edit the wireless interface
- Click Save
LAN
The LAN panel shows basic information about the device and connected clients IP addresses.
From the LAN status panel you can configure the DHCP settings for the device.
Configuration
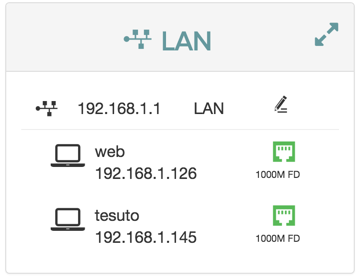
To open the Edit LAN Settings dialog, click the ![]() edit button.
edit button.
To view a more detailed overview of the clients, click the ![]() expand button
expand button
To view details about a client click the client in the list.
Overview
Detailed Client Overview
In The Detailed Client Overview, information about the clients in the LAN is displayed.
Edit LAN Settings
In The Edit LAN settings view you can change different features about your network.
Client
The Client dialog displays information about the connected clients and allows you to edit their configuration.
Detailed Client Overview
In The Detailed Client Overview, information about the clients in the LAN is displayed.

| Item | Description | |
|---|---|---|
| Hostname | Client hostname. | |
| IP Address | Client IPv4. | |
| MAC Address | Client MAC Address . | |
| Port | Device port. | |
| Network | Network interface for the client. | |
| Link Speed | Type of negotiation, speed and duplex for the connection. |
Edit LAN Settings
In The Edit LAN settings view you can change different features about your network.
Configuration
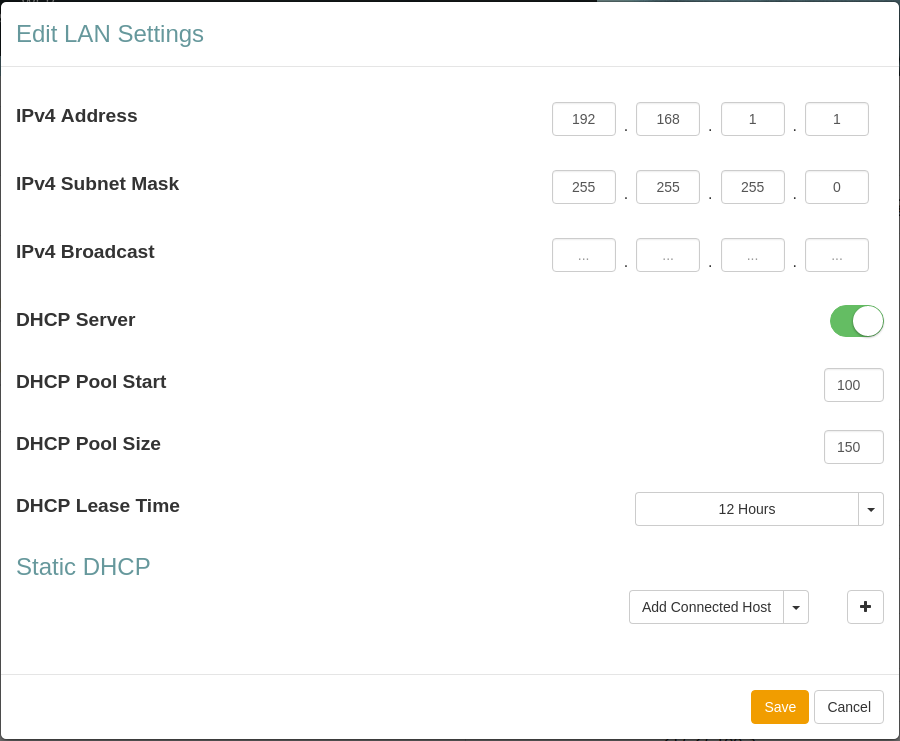
| Item | Description |
|---|---|
| IPv4 Address | Device DHCP address |
| IPv4 Subnet Mask | IPv4 Subnet Mask |
| IPv4 Broadcast Mask | IPv4 Broadcast Mask |
| DHCP Server | Turn DHCP Server on or off. |
| DHCP Pool Start | Start IP number for the DHCP Pool start number IP address |
| DHCP Pool Size | Number of IP addresses in the DHCP Pool |
| DHCP Lease Time | DHCP Lease Time for the LAN. |
| Static DHCP | Reserve an IP address DHCP Lease for a connected device. |
Static DHCP
The Static DHCP section lets you configure IP address DHCP Leases for connected devices.
Configuration
Add Static DHCP Lease
To add a static DHCP lease:
- Add an existing client or create a lease from scratch:
- To select an existing client:
- Click Add connected host to open the list
- Select the desired client
- Click the
 add button
- To add a static DHCP lease manually:
- Only click the
 add button
The information for existing client is added automatically.
- Add or edit the client information as neeed.
- Click Save
Client
The Client dialog displays information about the connected clients and allows you to edit their configuration.
View
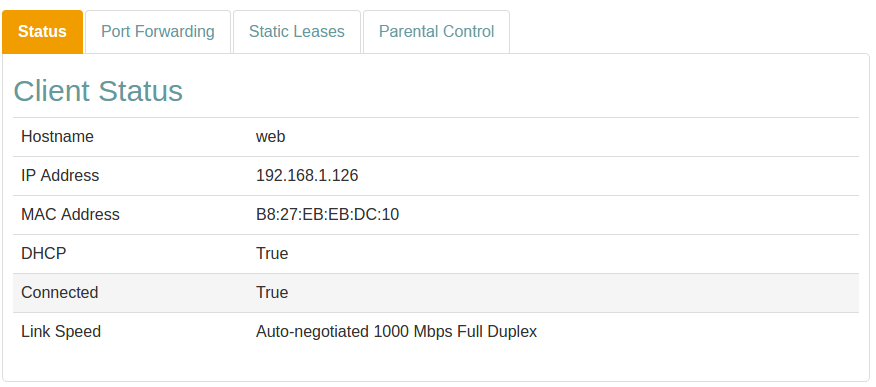
Information about the client is divided into several tabs.
Overview
Port Forwarding
In the Port Forwarding tab you can map incoming connections on different ports to ports on the client.
Static Leases
The Static Leases tab allows you to assign a static IP address dhcp lease to the client.
Realtime Graphs
The Realtime Graphs view provides access to graphical representations of status for the device. The graphs scroll as time progresses and lines indicate the current status.
WiFi Realtime Graphs
For WiFi clients (it is not shown for regular LAN clients), the Realtime Graphs tab you can map incoming connections on different ports to ports on the client.
Status
The Status tab shows information about the client and the connection.
Status Information
| Item | Description |
|---|---|
| Hostname | The client Hostname. |
| IP Address | Assigned IP address. |
| MAC Address | MAC address. |
| DHCP | DHCP status. |
| Connected | Connection status. |
| Link Speed | Type of negotiation, speed and duplex for the connection. |
Wireless Details
For WiFi clients, the Wireless Details section shows detailed information about the wireless connection. All data is measured since last downtime.
| Item | Description | Example |
|---|---|---|
| Frequency | WiFi frequency band for the access point. | 2.4GHz |
| RSSI | RSSI strength for the signal. | -64 dBm |
| SNR | Signal-To-Noise-Ratio. | 21 dBm |
| Idle | Time idle. | 1 s |
| In Network | Time in network. | 1813 s |
| WME | Status of WMM. | True |
| Power Save | Is Power save enabled? | False |
| N Mode | Is 802_11n supported? | True |
| VHT Mode | Is 802_11ac supported? | False |
| TX Bytes | Transmitted bytes. | 2438426 |
| RX Bytes | Recieved bytes. | 347988 |
| TX Rate | Transmission rate. | 58 Mbps |
| RX Rate | Recieve rate. | 6 Mbps |
Port Forwarding
In the Port Forwarding tab you can map incoming connections on different ports to ports on the client.
Mapping Section
| Item | Description |
|---|---|
| Name | Port name. |
| Excluded ports | Protected ports that can't be mapped. |
| Public port | Public (external) port. |
| Private port | Private (client) port. |
| Protocol | Protocol. |
Protocol
The protocol setting filters traffic by protocol for the port forward.
Mapping Settings
To map incoming connections:
- Click Add mapping to open the mapping section
The mapping section lets you add configuration settings for the mapping.
Ports can be added one by one (80), as comma-separated lists (8080, 8090) or as ranges (21-22).
- Add information:
- Add a name as identification
- Add ports:
- Add public/incoming port(s)
- Add private/client port(s)
- Select protocol
- Click Save
- Click Close
Your information has now been saved and is visible in the mapping list.
Static Leases
The Static Leases tab allows you to assign a static IP address dhcp lease to the client.
Static Leases Section
Static Leases Settings
To assign a static address to the client:
- Click the
 add button to open the section
- Add information for the type of network(s) you use
Parental Control
Parental control is used to restrict access to the network for particular devices.
Internet Access Scheduling
Parental control is handled by setting schedules where access is restricted to explicitly named MAC addresses.
| Item | Description |
|---|---|
| Weekdays | List of days the filter applies. |
| Start Time | Time of day to start filtering. |
| Stop Time | Time of day to stop filtering. |
| | Edit filtering rule. |
| | Delete filtering rule. |
Add Parental Control
The Internet Access Schedule rules you add from the client panel will only apply to that client.
Internet Access Scheduling
Parental control is handled by setting schedules where access is restricted to explicitly named MAC addresses.
When adding a parental control filter from the client panel, the MAC Address is automatically selected from the client.
Add an Internet Access Schedule
- Select a Time Frame from the menu
- Edit the selected Days as needed
- Enter a time:
- From
- To
- Click Save
- Click Close
Start and Stop Times
The start time for a rule has to be lower than the end time.
If you want to have a rule that goes over midnight, you need to add two rules, one up until midnight, and one from midnight to when you want the rule to end.
For example:
Rule one: From 21:00 To 23:59
Rule two: From 00:00 To 06:00
A single rule of From 21:00 To 06:00 will not be saved.
WiFi Realtime Graphs
For WiFi clients (it is not shown for regular LAN clients), the Realtime Graphs tab you can map incoming connections on different ports to ports on the client.
Graph
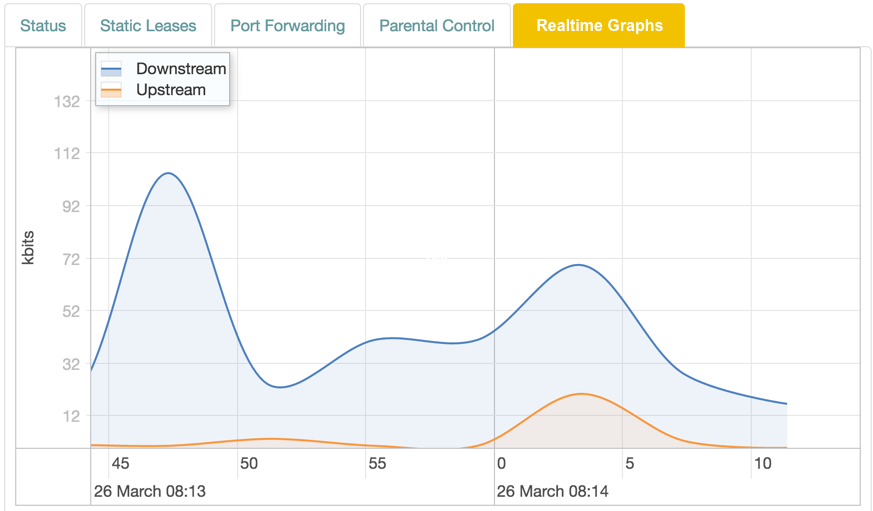
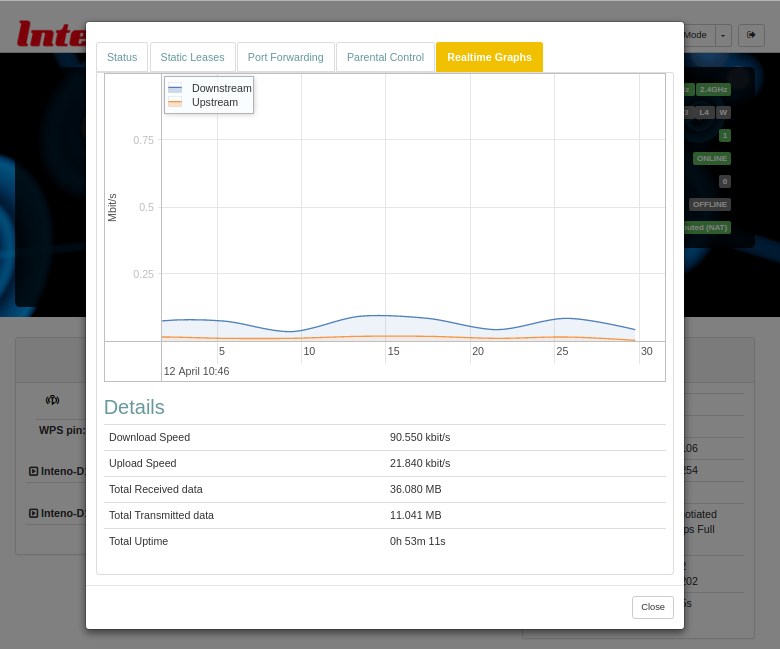
The display is shown in realtime, with lines representing traffic in kbit/s:
| Color | Traffic |
|---|---|
| Blue | Downstream. |
| Red | Upstream. |
Table
The table below the graph displays collected data since the tab was opened, and the total connection uptime since last downtime.

| Item | Description |
|---|---|
| Download Speed | Current download speed. |
| Upload Speed | Current upload speed. |
| Total Received Data | Downloaded data since the tab was opened. |
| Total Transmitted Data | Transmitted data since the tab was opened. |
| Total Uptime | Connection uptime since last downtime. |
Realtime Graphs
The Realtime Graphs view provides access to graphical representations of status for the device. The graphs scroll as time progresses and lines indicate the current status.
Overview
Load
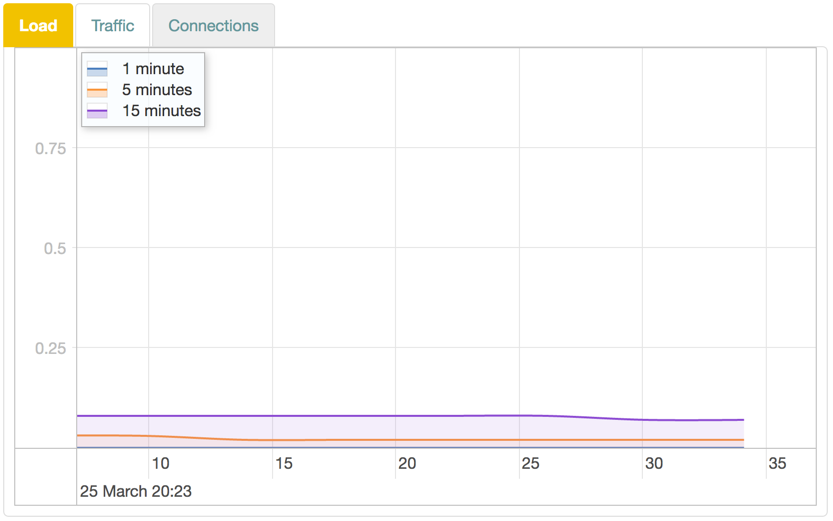
The Load graph shows device load averages for different time recent periods.
Graph Lines
The display is shown in realtime, and the lines represent the average over different intervals:
| Color | Time |
|---|---|
| Blue | 1 minute |
| Red | 5 minutes |
| Purple | 15 minutes |
Traffic
The Traffic graph shows upload and download traffic for the interfaces.
Graph Lines
Each interface is available in its own tab. The display is shown in realtime, with lines representing traffic in kbit/s:
| Color | Traffic |
|---|---|
| Blue | Downstream. |
| Red | Upstream. |
WAN
Configuration
| Item | Description |
|---|---|
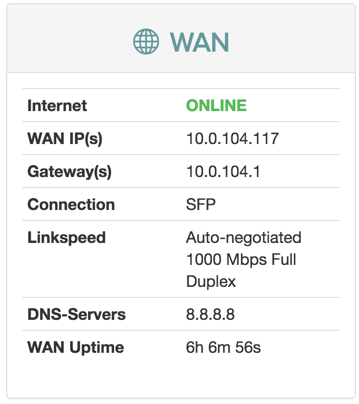
| Internet | Status of Internet connection. |
| Link | Status of link. |
| WAN IP(s) | IPv4 and IPv6 address to the device. |
| Gateway(s) | IPv4 and IPv6 address to gateway. |
| Link Type | Ethernet |
| Link Speed | Auto-negotiated 1000 Mbps Full Duplex |
| DNS-Servers | IPv4 and IPV6 addresses to DNS servers. |
| WAN uptime | Time since last disconnect for IPv4 and IPV6 WAN connection. |
Voice
The Voice panel shows the status of the ringing schedule connected phone lines.
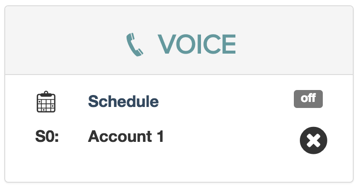
The Voice panel is not available in certain regions.
Profile
The Profile panel shows the network profiles configured on your device, if any.
The network profiles are configured by the manufacturer for each device type.
Depending on the network profile selected, additional panels may be displayed in the overview.

